Chart Options
The OPTIONS tab in the chart configuration panel allows customization of a chart's presentation. Different chart types have different options.
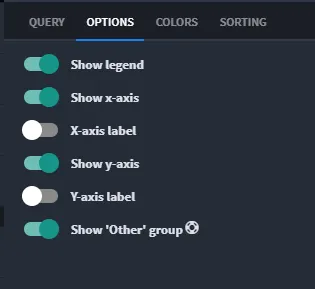
Here are the many options available to you with charts:
Chart Option | What it Does | Available With |
|---|---|---|
Show Legend | Displays a legend to the right of the chart. | all bar charts, multi-series line charts, stacked area and 100% area charts, pie and donut charts, heat map |
Show X-Axis | Displays the x-axis of the chart. | all bar charts, all line charts, all area charts, heat map |
X-Axis Label | Displays text as a label under the x-axis. | all bar charts, all line charts, all area charts, heat map |
Show Y-Axis | Displays y-axis of the chart. | all bar charts, all line charts, all area charts, heat map |
Y-Axis Label | Displays text as a label to the left of the y-axis | all bar charts, all line charts, all area charts, heat map |
Show 'Other' Group | Shows data items that do not fit on the chart, grouped together under an Other item. This option indicates whether to show that item in the chart or not. | all charts |
Auto Scale | Changes the y-axis scale from the minimum value of the measure to the maximum value of the measure. | line charts, area charts |
Show Value Labels | Displays labels on pie and donut charts. | pie and donut charts |
Explode Slices | Displays the radius of the slices of a pie chart proportional to their size. | pie charts |
Smooth or Line Interpolation | Uses an algorithm to interpolate a smoothe curve from discrete data points. Sub-options include: Basis, Cardinal, Catmull Rom, Linear, Monotone X, Monotone Y, Natural, Step, Step After, and Step Before. | all line charts, all area charts |
Bubble | Replaces data points in the chart with bubbles, where the bubble size represents an additional dimension of data. | bubble charts |