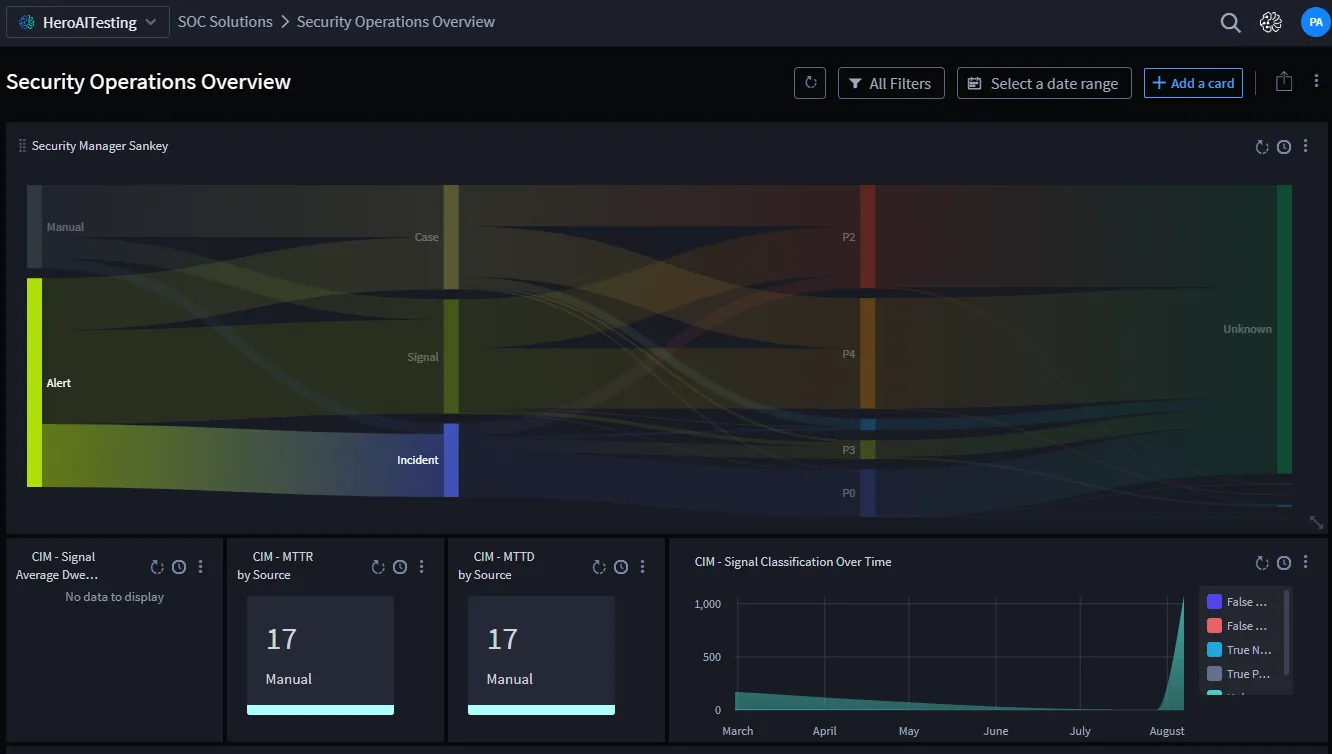
Dashboards
A Swimlane Turbine dashboard is a visual display of records, reports, and charts associated with the applications in the workspace. Each dashboard consists of cards, and a workspace can contain multiple dashboards.
Note: Users can only access Workspaces, Dashboards, Records, and Reports if granted permissions by an administrator. If a dashboard or report is not visible, contact your administrator to confirm access rights.
Dashboards enable flexible, real-time filtering and visualization of data. They support both global (dashboard-level) and card-level filtering, allowing users to interact with dynamic data without editing underlying reports. This is especially beneficial in MSSP environments, where dashboards may be scoped by customer identifiers (for example, customer ID, SLA, or time window), particularly in single-tenant architectures.
Key Benefits of Dashboards
- Flexible Filtering: Combine dashboard-wide and card-specific filters
- Real-Time Insights: Instantly view updated metrics
- Preset and Custom Ranges: Choose from predefined options or configure custom time windows
- MSSP-Focused Views: Filter by customer, SLA, or record ownership
- Export and Share: Download dashboards as seen or email them with active filters
Dashboards improve operational efficiency and standardize views across users and teams, providing visibility and agility to analysts and MSSP administrators alike.
Accessing Dashboards
To access dashboards:
- From the global navigation menu, go to Workspaces.
- Select a workspace to view its dashboards.
- Each dashboard is listed by name. Select a dashboard to open it.
Note: Dashboards are scoped at the tenant level and can belong to multiple workspaces.
Dashboard Operations
The dashboard includes a toolbar that allows users to:
- Mark as Favorite: Select the star icon next to the dashboard name to mark it as a favorite. This helps quickly access important dashboards from the dashboard list.
- Refresh Data: Click the refresh icon to reload data.
- Add a Card: Select + Add a card to add a visualization. This action mirrors the experience of adding a card from the Home page.
- All Filters: Apply runtime filters to cards across the dashboard. Filters are application-scoped. Cards tied to a filtered application will be affected; others will remain unchanged. You can apply multiple filters for different applications, each affecting only relevant cards.
- Report-level filters are preserved. Dashboard-level filters are applied on top of report-level filters.
- If a user has access to a dashboard but not a specific report used within it, the card will display a "No data available" message.
- Apply Date Range Filters: Select a date range such as Last 7 Days or define a custom time window.
- If no date field is configured for any application, the Date Range filter will be disabled. Once enabled, the default value is Today so far. You can configure date fields under Settings and Schedules → Time Filters.
- Sharing Options: Use the share icon to download, schedule, or email snapshots.
- Manage Settings: Select the vertical ellipsis (⋮) to:
- Create a new dashboard
- Open Settings and Schedules to edit name, description, permissions, and configurations
- Delete the dashboard
- Create or edit the associated workspace