Events
Within Turbine, orchestrators and practitioners can view event logs for the last 24 hours. You can see the type of event, the name of the agent/host, the date and time stamp that it was received, and how many playbooks that event triggered. You can also click on events to drill into additional details, including skipped playbooks and event-specific data.
Events play a crucial role in triggering automation workflows, helping organizations manage security incidents and other operational tasks efficiently.
Accessing Events
To access events, follow these steps:
- Log in to Turbine.
- From the left-hand navigation pane, click ORCHESTRATION, Openrational Health, and click Events.
- Click on an event to view additional details, such as skipped playbooks and event-specific data.
Benefits of Event Management in Turbine
- Real-Time Event Tracking: Immediate visibility into critical incidents and updates.
- Automation Triggers: Events automatically trigger playbooks for streamlined workflows.
- Detailed Logs: Comprehensive information on event source, time, triggered actions, and skipped playbook reasons.
Types of Events
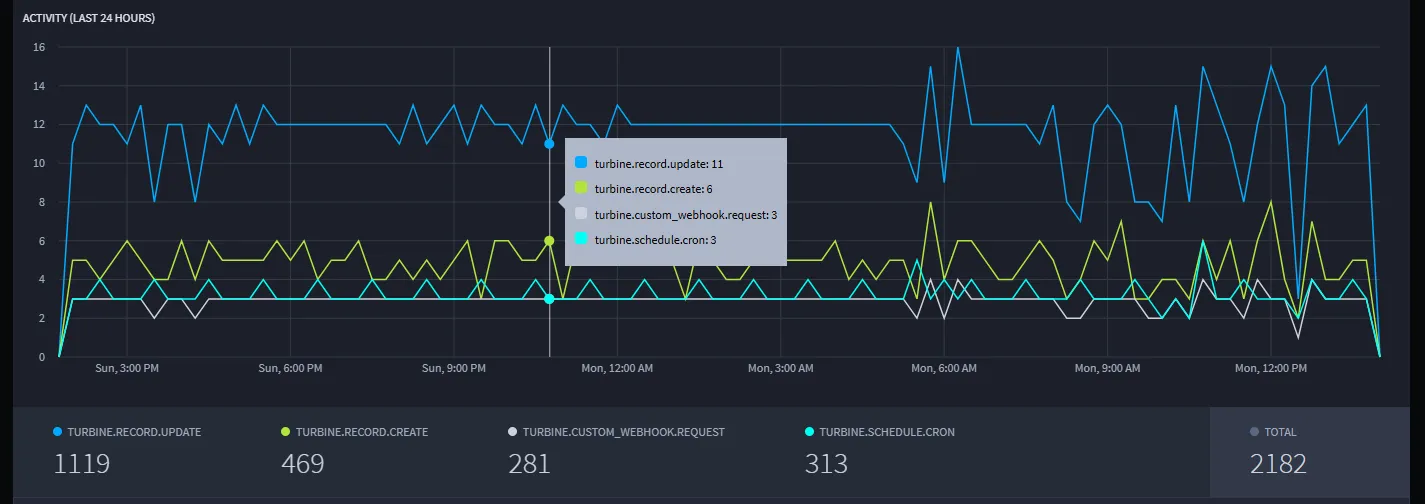
Events in Turbine can be classified into different types, as shown in the image below:
- turbine.record.update: Events triggered when records are updated in the system.
- turbine.record.create: Events triggered when new records are created.
- turbine.custom_webhook.request: Events generated by webhook requests from third-party tools.
- turbine.schedule.cron: Events triggered by scheduled cron jobs or tasks.
Graphical Representation
The graph shows event activity over the past 24 hours, broken down by event type:
- Blue Line (turbine.record.update): Indicates record update events, with frequent peaks throughout the 24-hour window.
- Green Line (turbine.record.create): Represents record creation events, showing consistent activity with occasional spikes.
- Gray Line (turbine.custom_webhook.request): Displays webhook request events, maintaining relatively steady occurrences.
- Cyan Line (turbine.schedule.cron): Reflects scheduled cron tasks, which exhibit periodic consistency.
Hovering Over the Graph
When hovering over the graph, a tooltip appears with specific event counts at that point in time:
- turbine.record.update: Displays the number of record update events.
- turbine.record.create: Shows the count of new record creation events.
- turbine.custom_webhook.request: Displays webhook request event counts.
- turbine.schedule.cron: Shows the number of scheduled cron events.
Insights: Hovering over specific data points allows you to identify patterns and anomalies at a glance. This helps in understanding when certain types of events occur more frequently, providing insights into operational workflows, peak activity times, and potential issues that need investigation.
Event Summary
The following event types were recorded over the last 24 hours:
- turbine.record.update: 1119 events
- turbine.record.create: 469 events
- turbine.custom_webhook.request: 281 events
- turbine.schedule.cron: 313 events
Total Events: 2182
Event Details
When viewing events in Turbine, the following detailed information is available:
- Event Type: The type or category of the event (for example, record update, record creation).
- Agent/Host: The name of the host or agent that generated the event.
- Time Received: The exact date and time the event was recorded in the system.
- Triggered Playbooks: The number of playbooks triggered by the event.
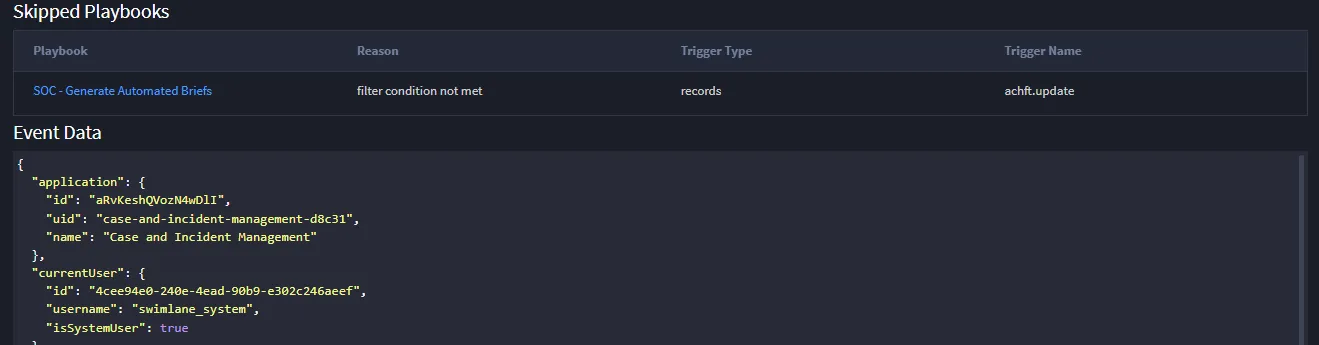
- Skipped Playbooks: The number of playbooks skipped and the reason they were skipped. A skipped playbook indicates that the event was received and evaluated, but the condition for executing the playbook was not met. As a result, the playbook did not execute.

Skipped Playbook Details:
- Playbook: The name of the skipped playbook. You can click on the link to open the playbook.
- Reason: Why the playbook was skipped (for example, filter condition not met).
- Trigger Type: The type of trigger (for example, records).
- Trigger Name: The specific trigger name (for example, achft.update).
- Event Data: Specific JSON or structured data relevant to the event, providing additional context.